
There are a number of key areas end users can review the driver information on the Motia Drive Smart portal.
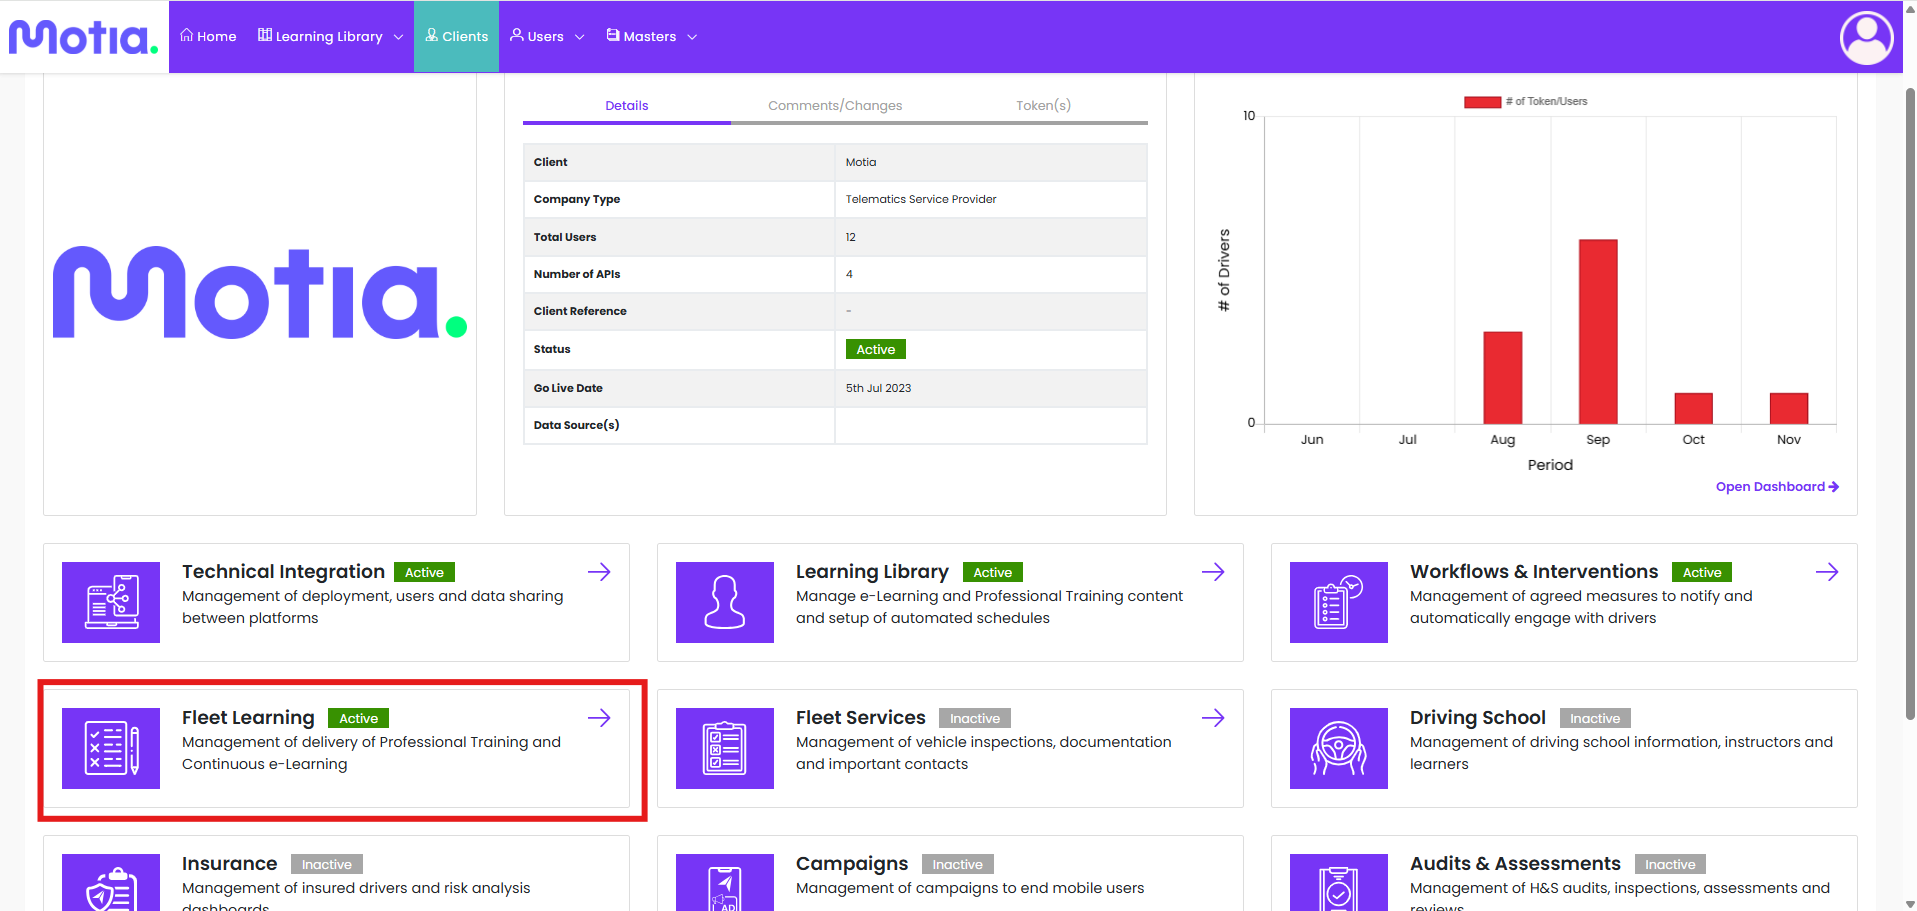
Step 1.
Navigate to the "Fleet Learning" section.
Step 2.
The first section "Dashboard" > "Driver & Vehicle" will give an overview of the;
- Number of vehicles & Drivers registered to that client account
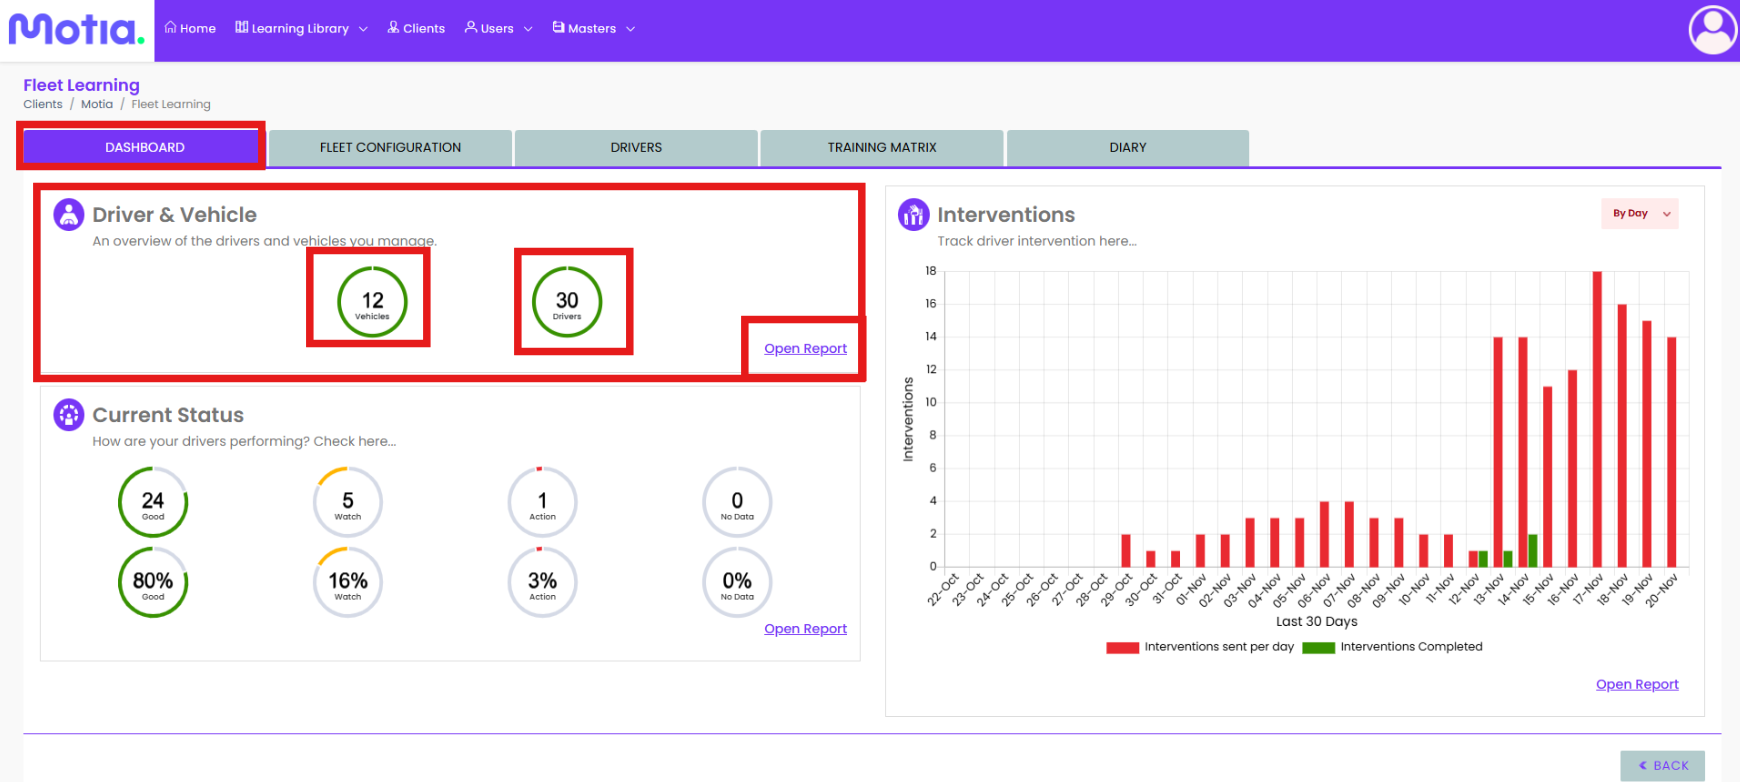
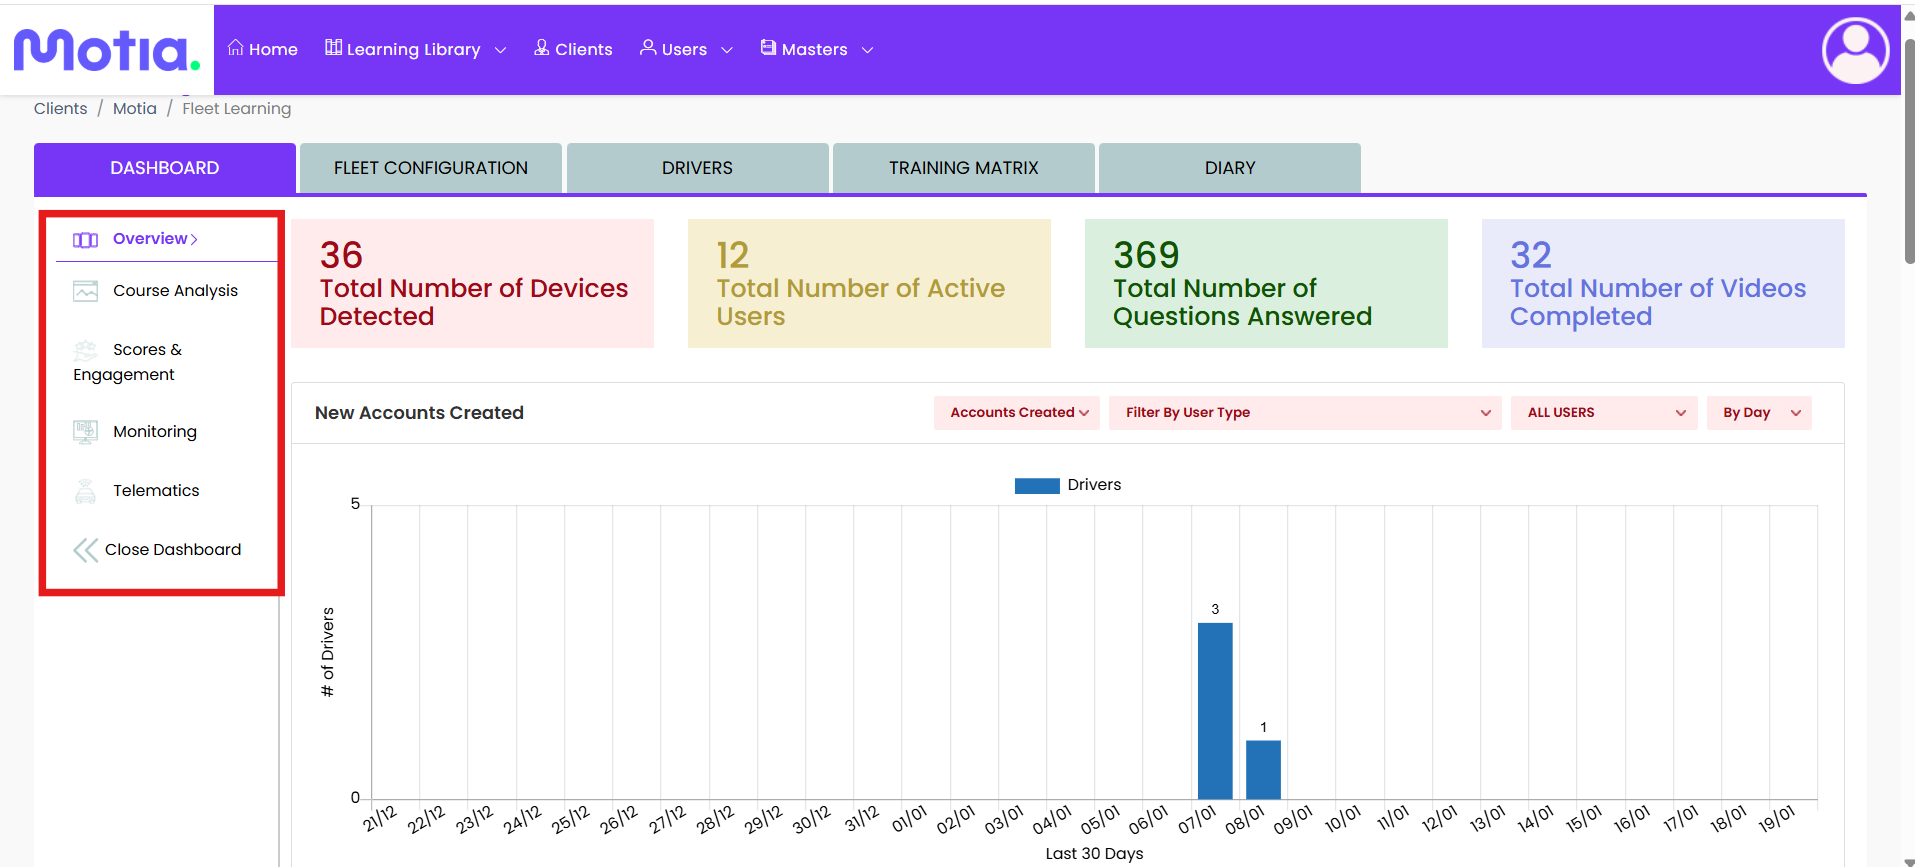
Clicking the "Open Report" section highlighted above opens a new window that gives users the option to check:
- Overview = Gives high level charts, such as how many drivers have registered & how many courses and videos have been completed by app users.
- Course Analysis = Gives breakdown of number of courses completed and questions Passed / Failed.
- Scores & Engagement = Shows score history and willingness to learn for app users.
- Monitoring = Shows the amount of app launches & how many users have notifications enabled or disabled on the app. (Without notifications enabled - app users will not receive intervention notifications form the Drive Smart App).
- Telematics = Gives a dashboard of all telematics data & their scores per metric & where drivers fall on their watch status's.
Step 3.
The next notable section is the "Current Status" section, highlighted below:
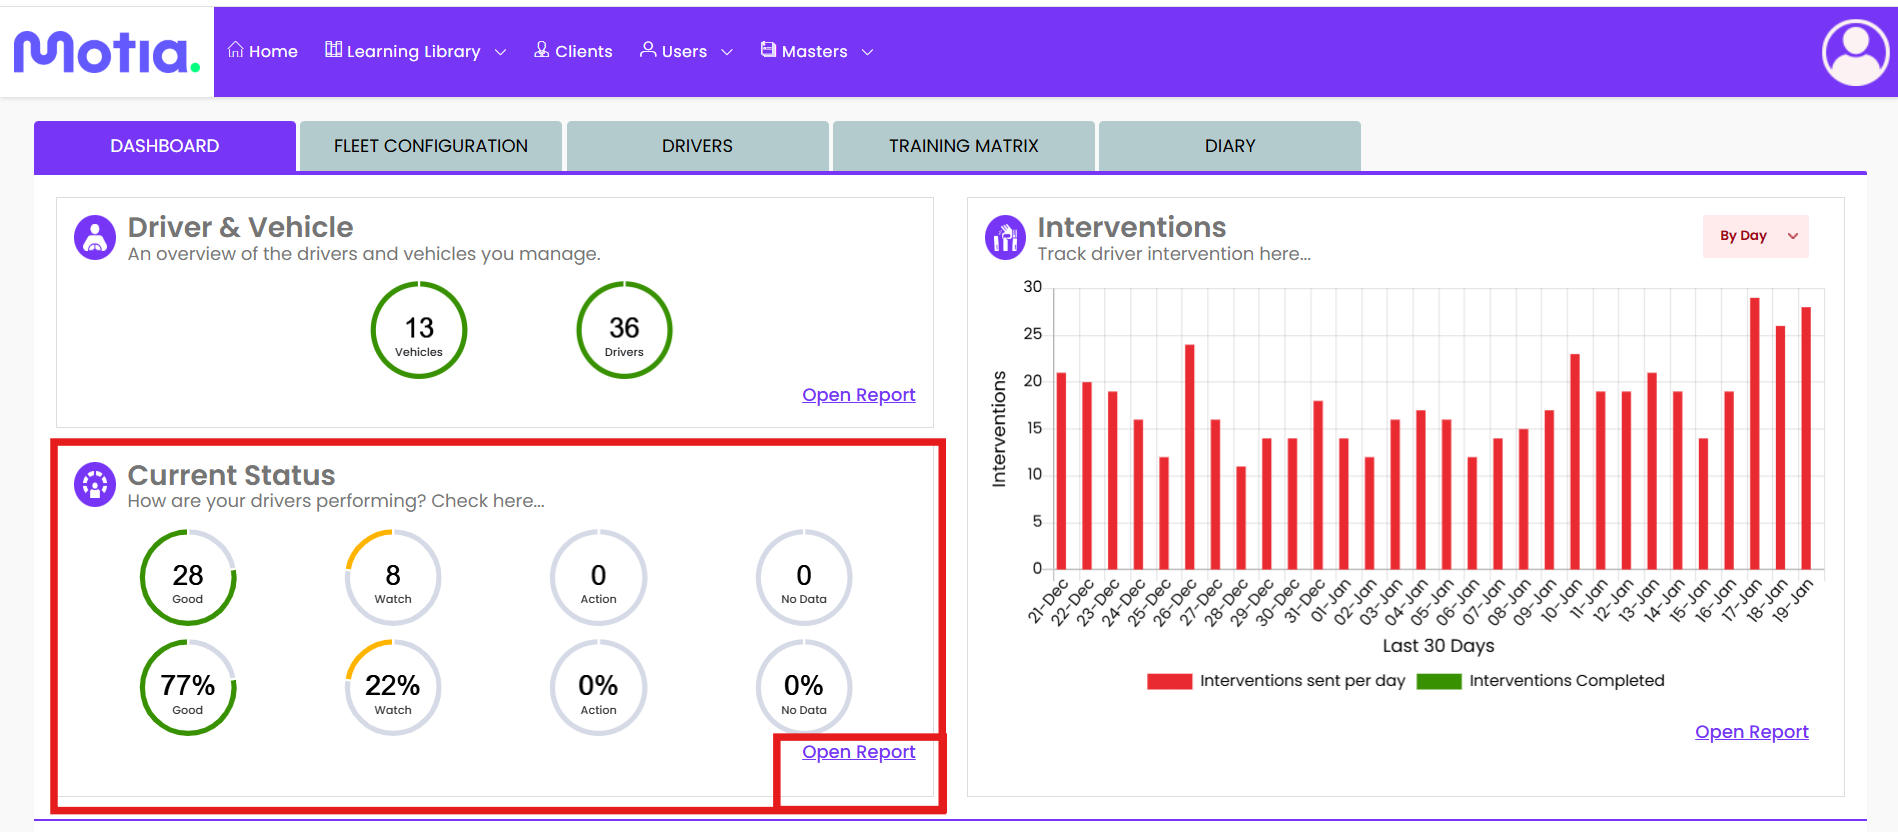
Gives a breakdown of the drivers current placing with in the intervention settings;
- Green = drivers are falling within the "Good" intervention settings and are not at risk, drivers can be pushed positive messages to reward their good driving.
- Amber = Drivers are falling within the "Average" intervention settings and the app is pushing tailored modules to improve their performance.
- Red = Drivers are falling in the worst intervention settings & need manual intervention outside of the Drive Smart app notifications. (Transport manager needs to speak to Driver etc).
Clicking the "Open Report" section, highlights again a high level chart of the people on each watch status and how the drivers are progressing throughout the last 30 Days.
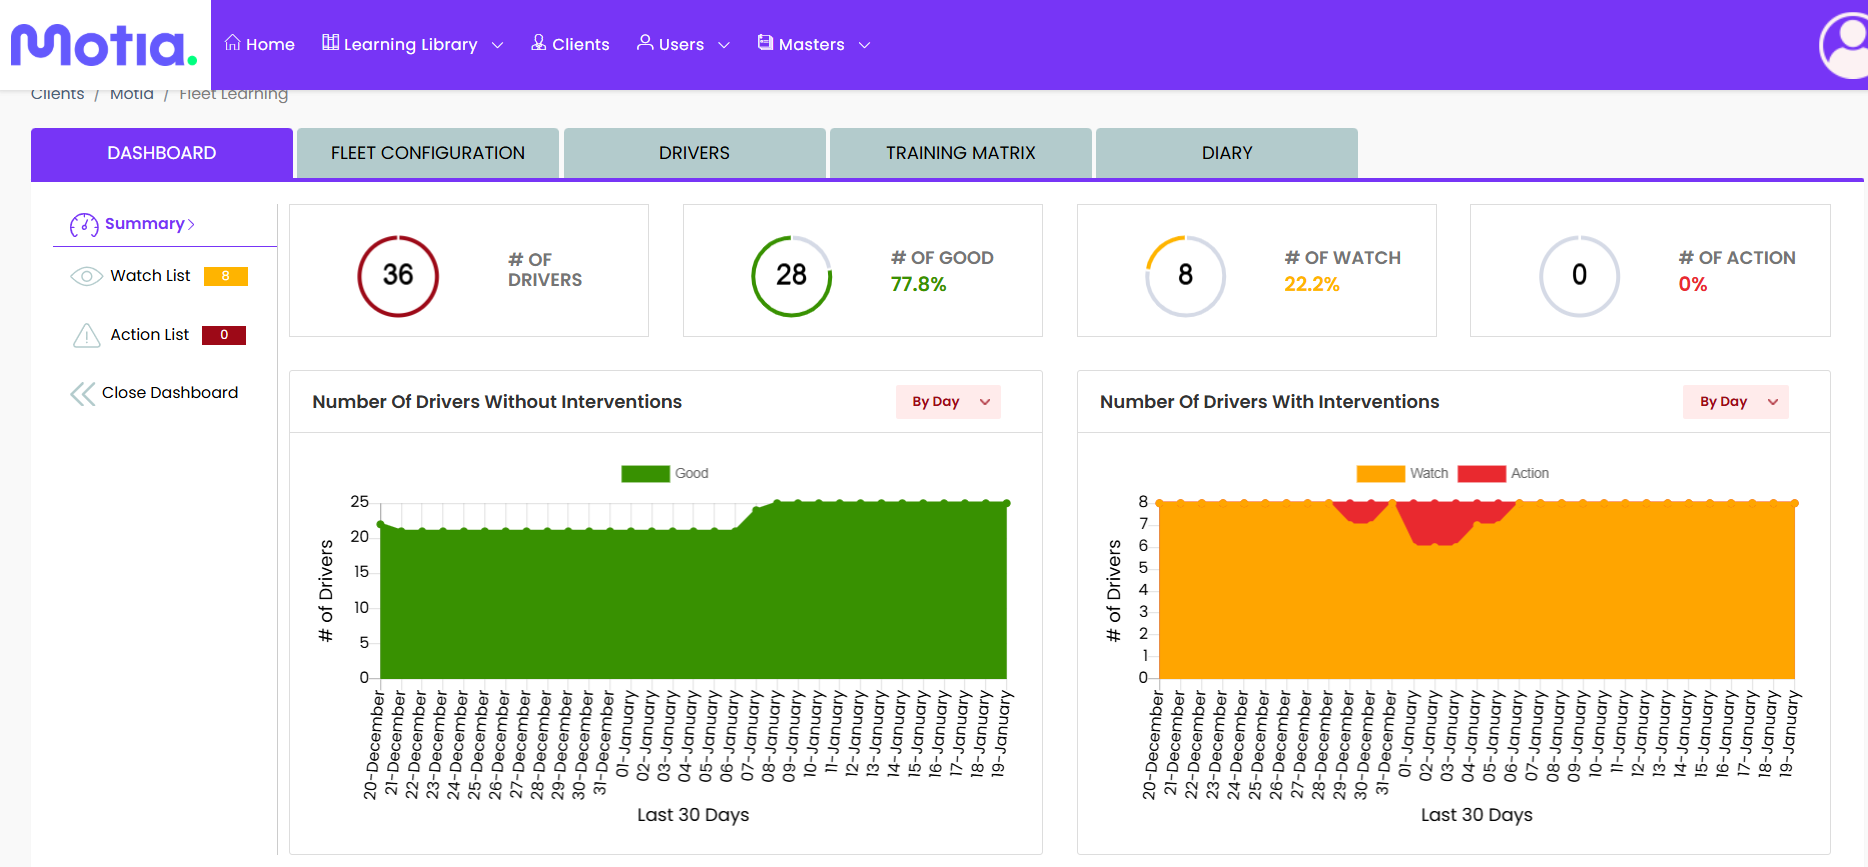
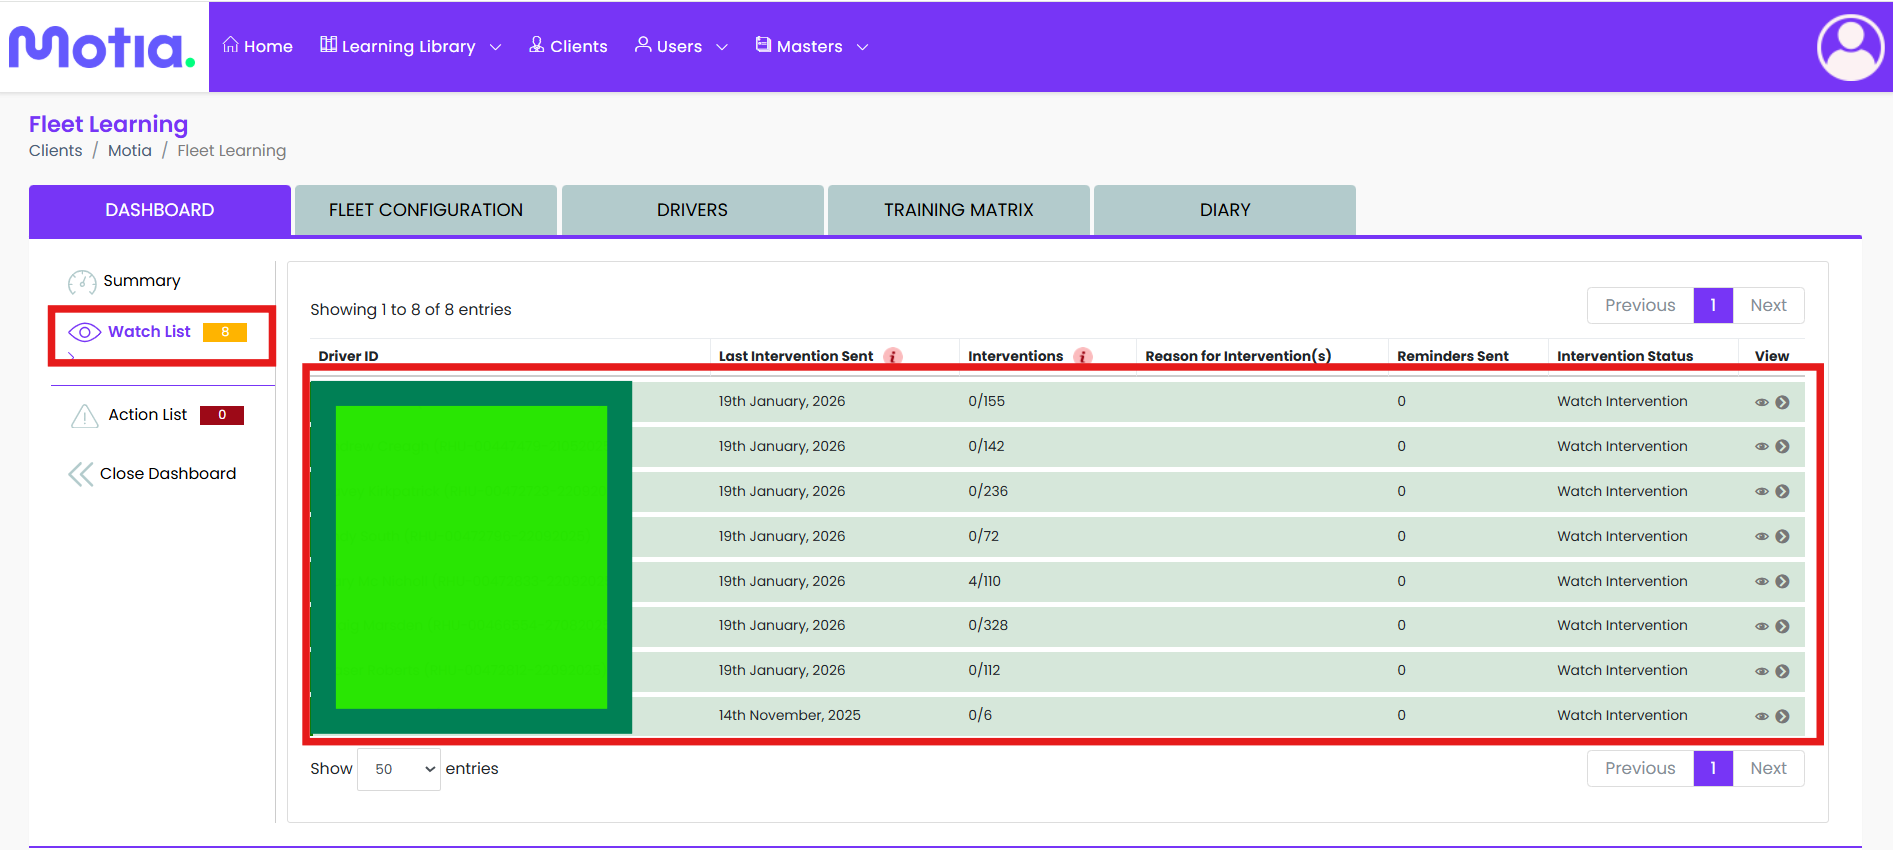
Selecting either "Watch List" or "Action List" will then populate the specifics of each driver within these "Lists", as below;
Step 4.
The last notable section within the "Dashboard" tab, is the "Interventions" section highlighted below;
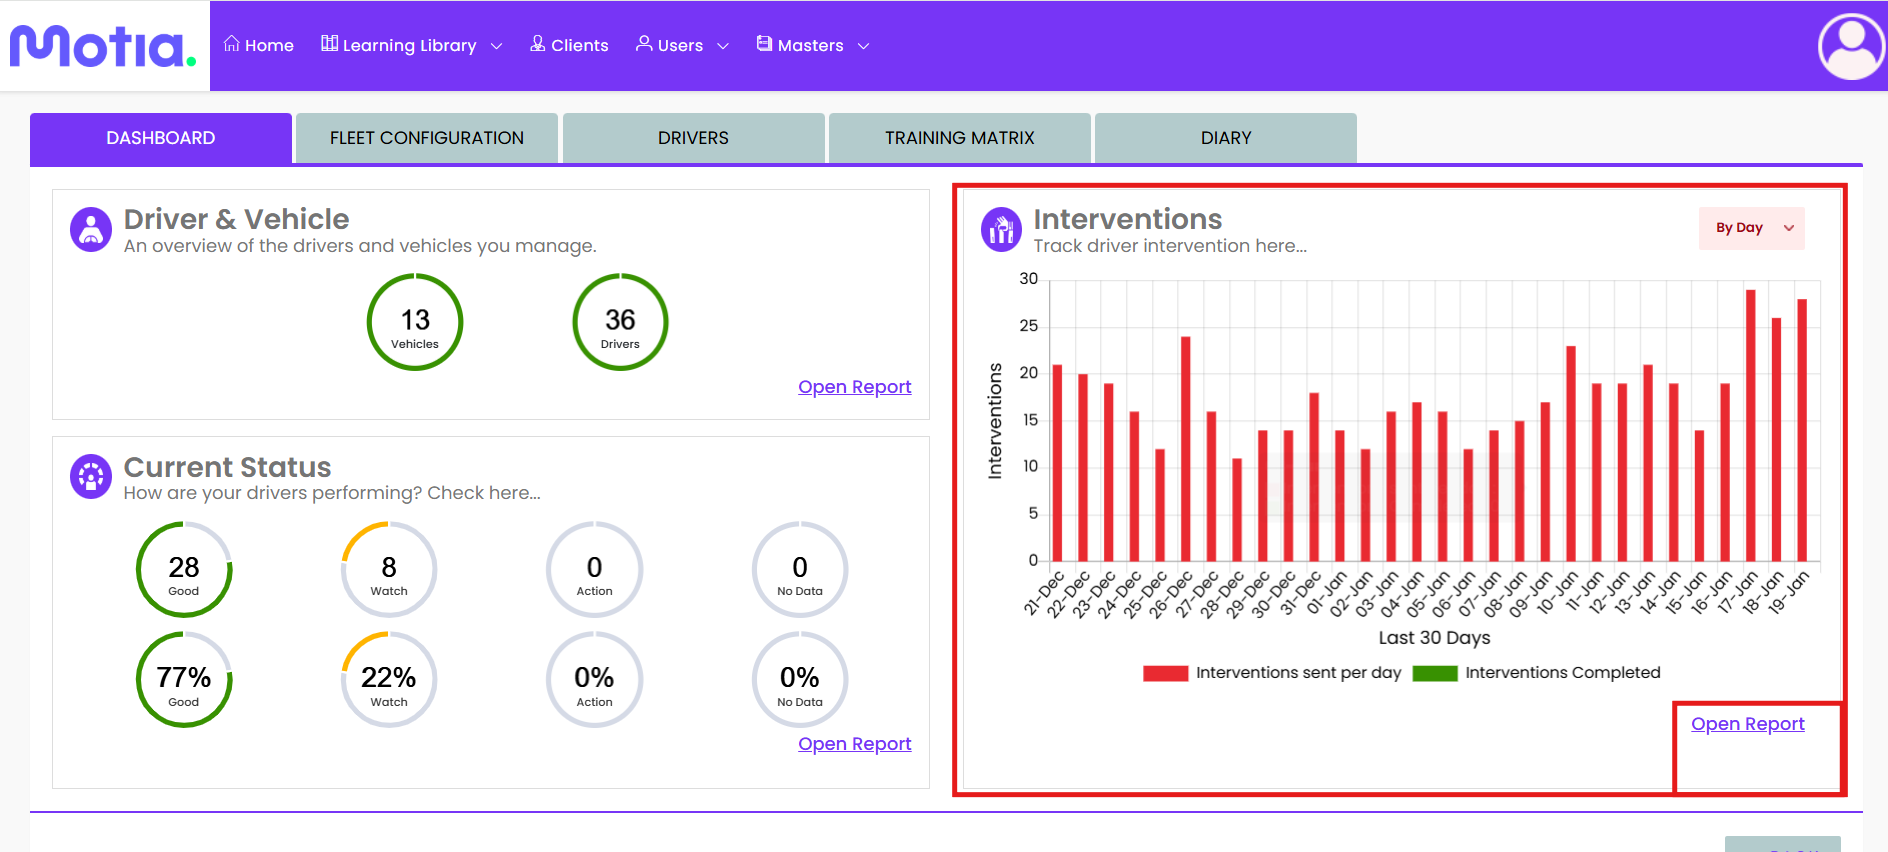
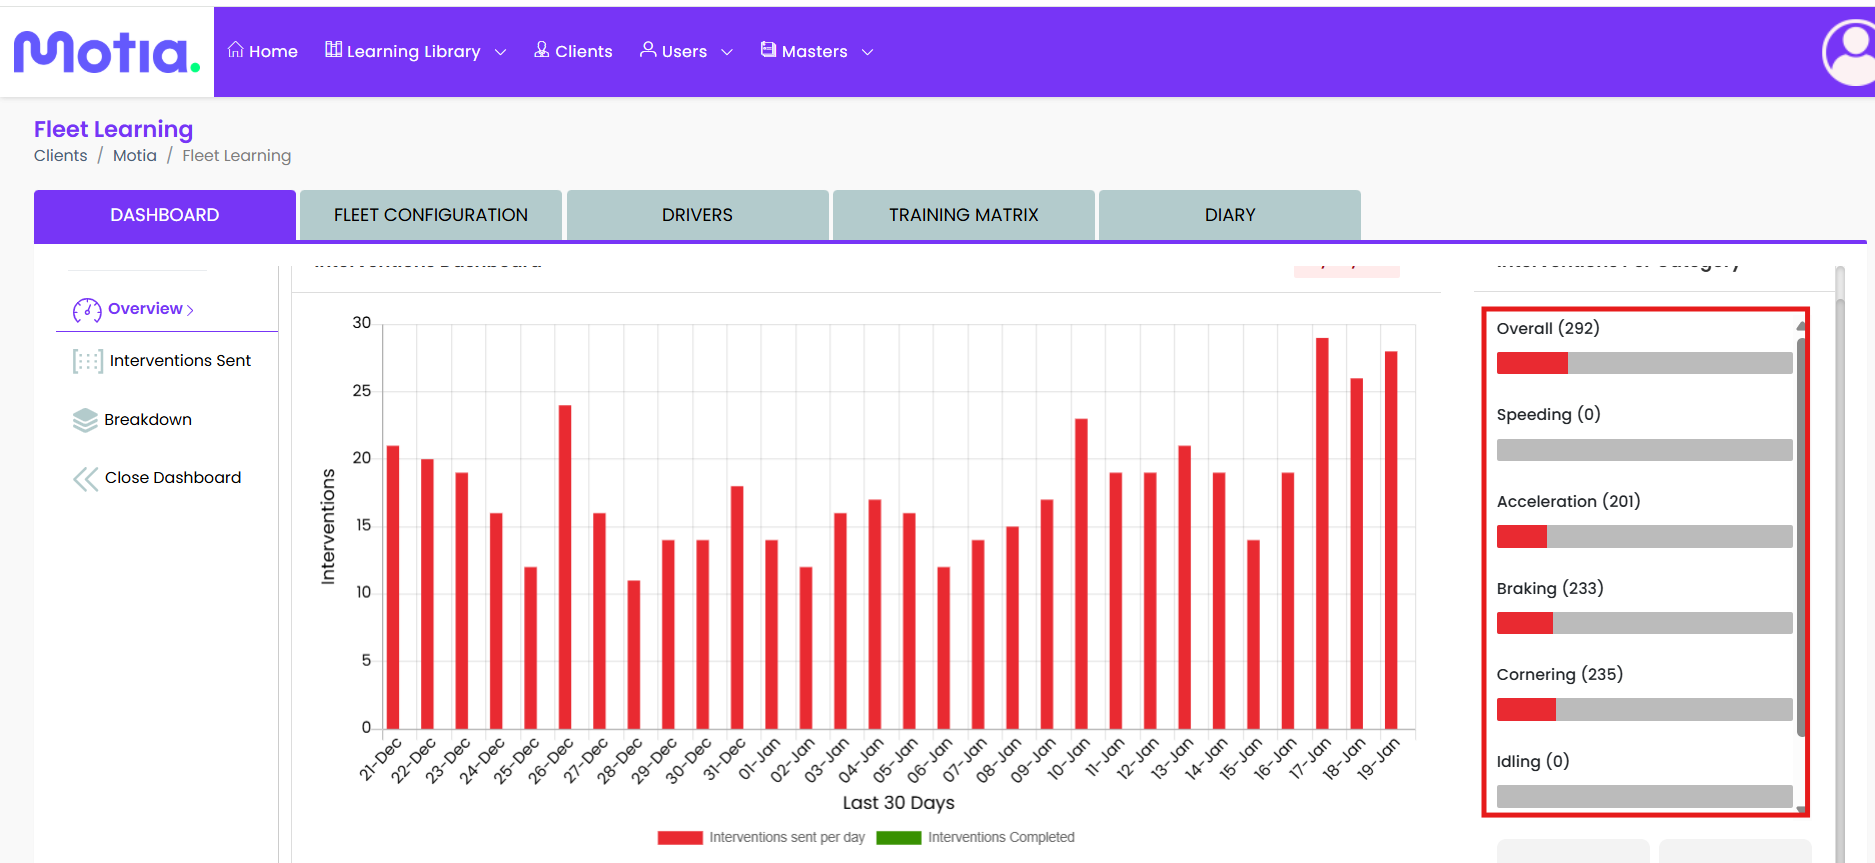
This section gives a visual of all of the interventions that have been sent over the past 30 Days. Clicking the "Open Report" section populates a new window, that gives a more in-depth breakdown of which telematics metrics these interventions were sent for:
Step 5.
The "Fleet Configuration" tab will give you an overview of the vehicles that are setup and the details associated to these vehicles.
Step 6.
the "Drivers" tab gives an overview of the status of each registered driver account:
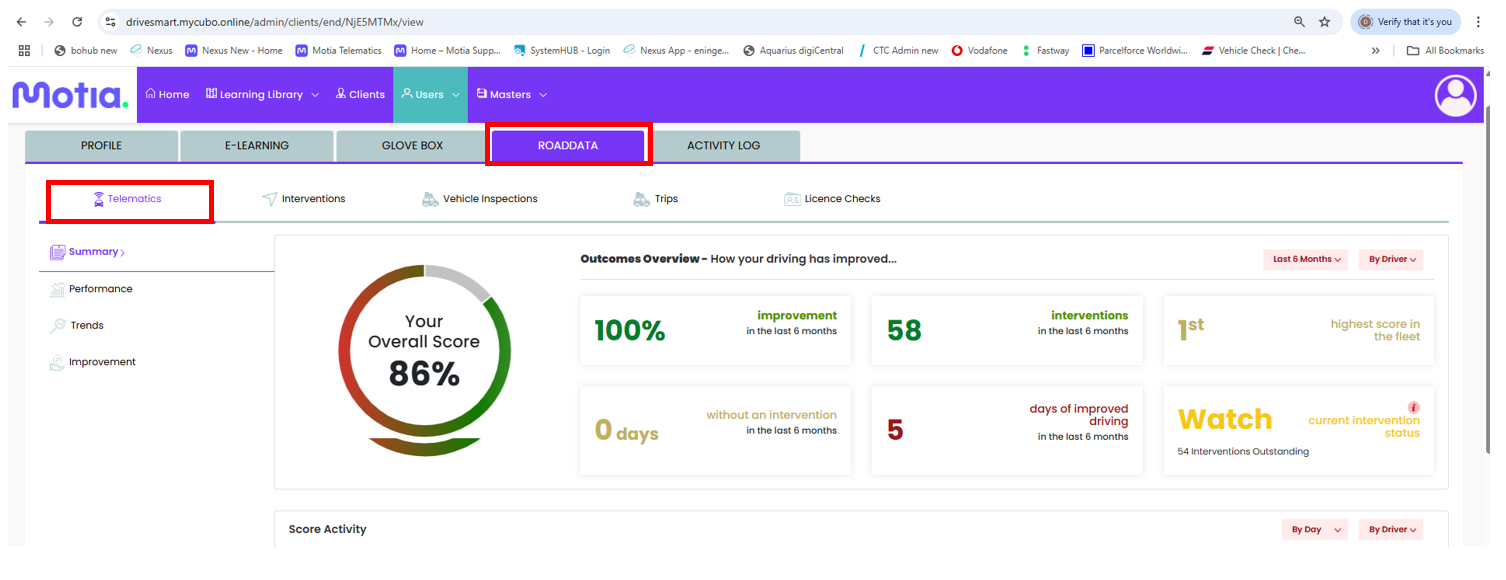
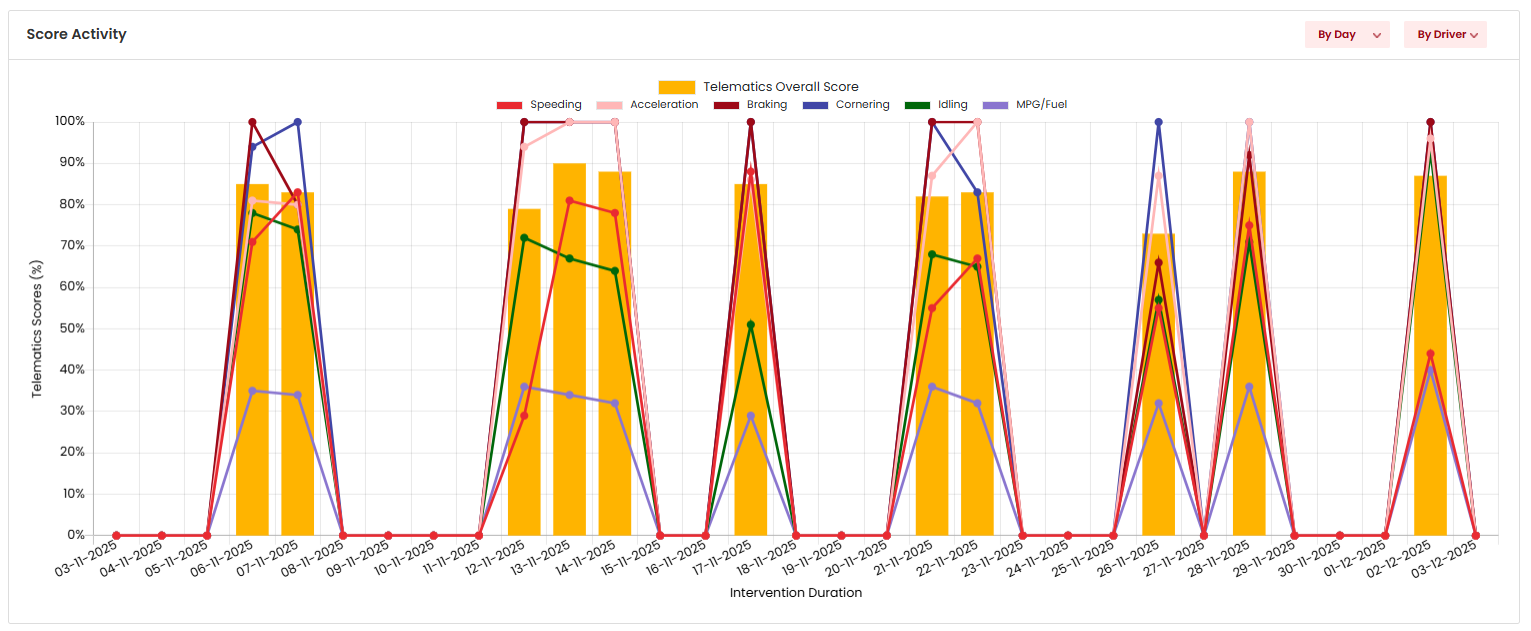
- Within this driver section, if you click the "Eye" icon - this will delve into specific metrics performance, under "Road data" >> "Telematics" section.
Step 7.
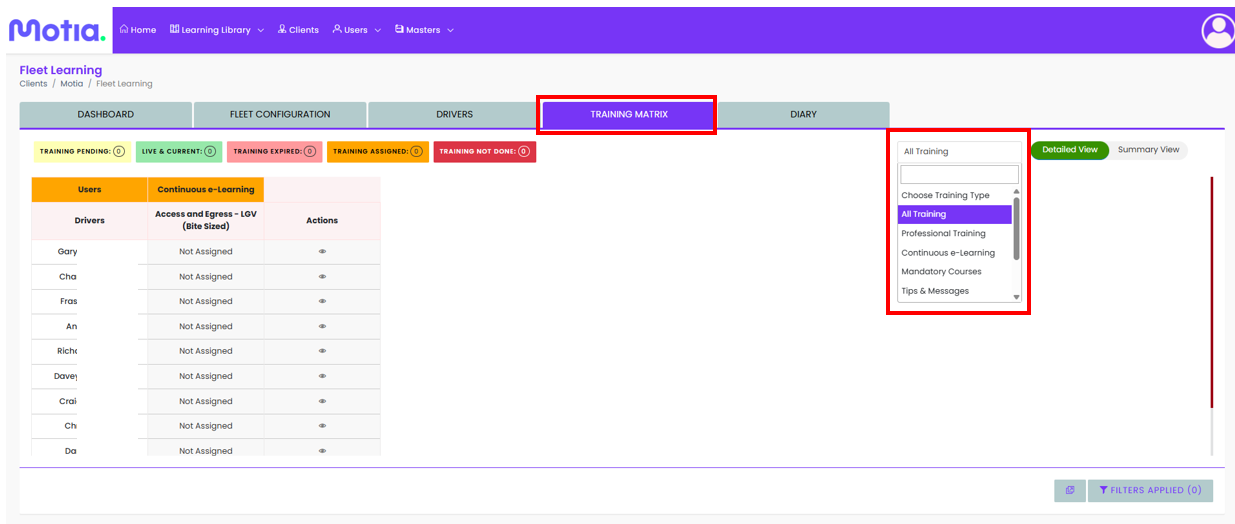
the "Training Matrix" tab allows users to see what training each end user / driver has completed or auctioned:
Step 8.
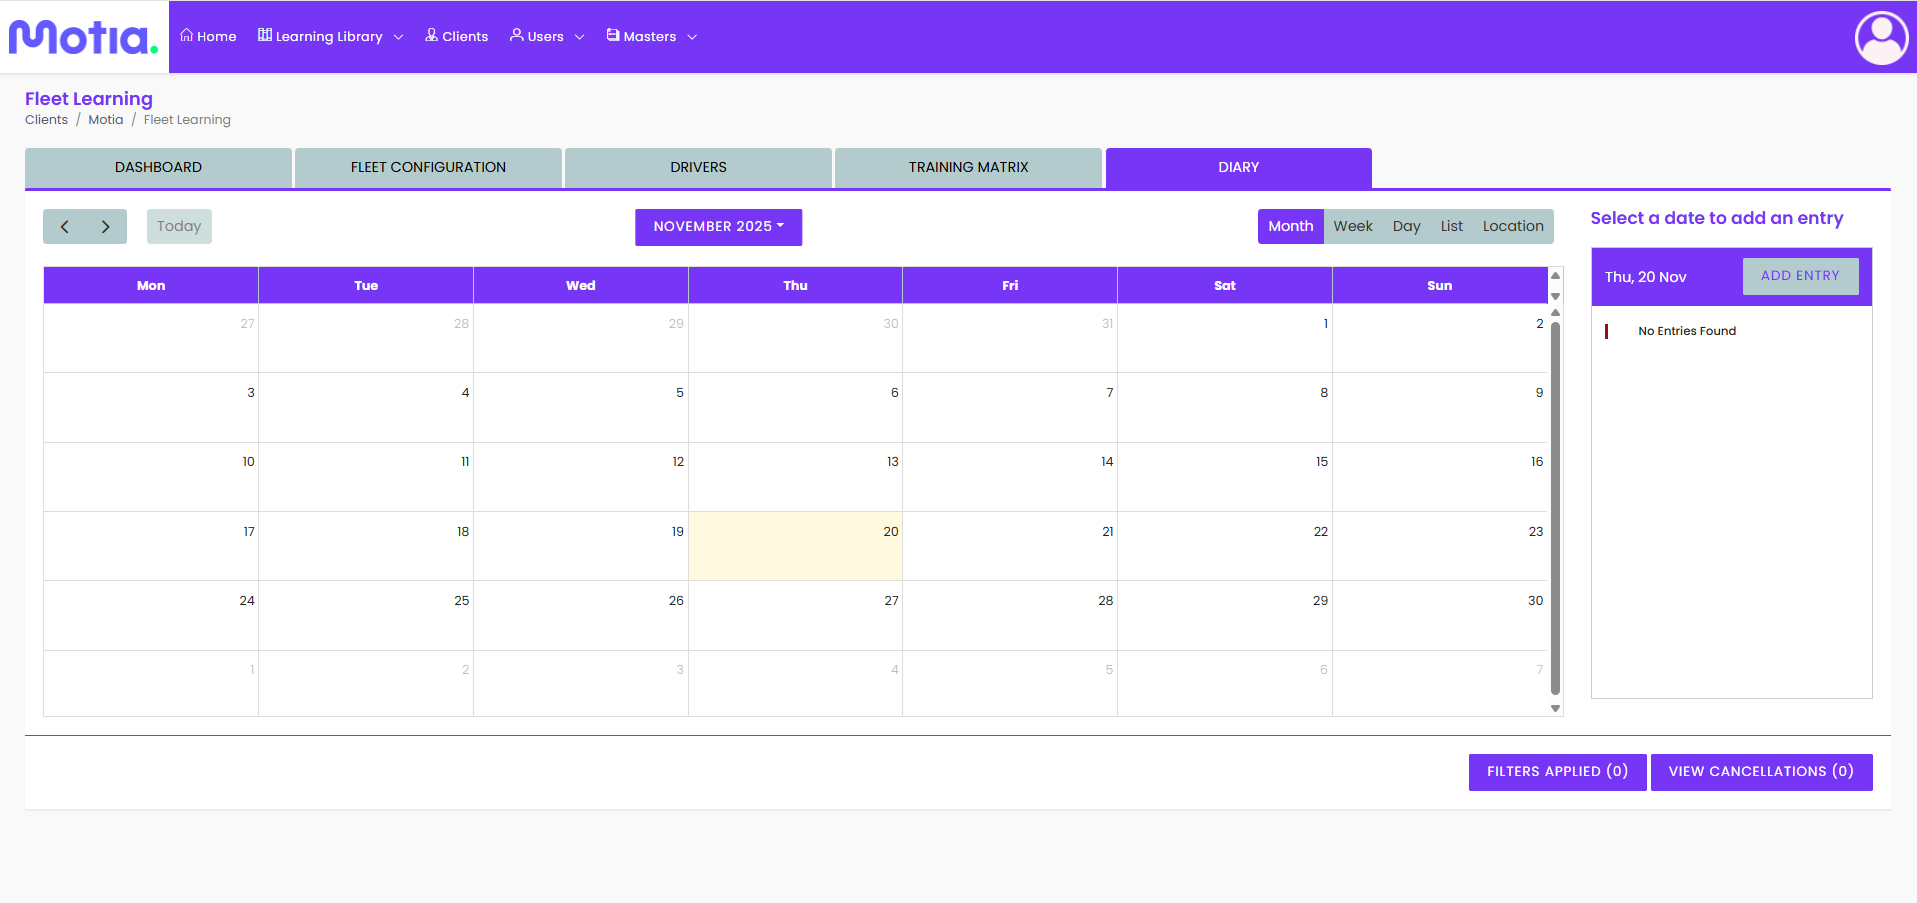
The "Diary" tab allows users to check the calendar entries for users.
Comments
0 comments
Please sign in to leave a comment.